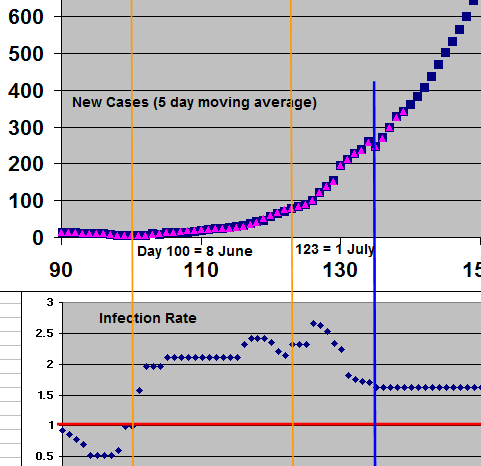
The virus has got away from us her in Victoria, Australia. A couple of slip ups and messaging which many, it appears, interpreted as ‘It’s all done’. Nothing further from the truth. The graphs below show it all started to go wrong on June 7 and the infection rate rose above 1 on June 9. It is good to see the infection rate reduced nearly immediately after the problem was announced. (Remember my model ‘backdates’ the infection rate to allow for incubation time.) However, the worry is after July 13 (blue line) we are stuck on a rate > 1. Most of the new cases are community transmission. We are in a much worse situation than the 1st wave when most cases were traced to overseas travelers. If this rate of infection does not come down then I predict we will go to even more stringent controls.